Unit Economics First: Prove AI ROI for CFOs in a 90 Day Test
Run this calculation before anything else: ROI = (Total benefits − Total costs) / Total costs × 100, tracked alongside Cost per Outcome as your unit-level metric. Predefine three KPIs, one revenue, one cost, one productivity, before you build anything. Most production initiatives with solid unit economics clear 100 to 300% or more, but payback often takes longer than sponsors expect, so build a 90-day unit test before committing to a full rollout.
TL;DR:
Establish a clear baseline for at least four to six weeks before AI deployment to ensure credibility and accurate attribution of benefits.
Count all direct, hidden, and ongoing costs, including model fees, compute, data engineering, and change management, which can inflate TCO figures by up to 40%.
Use scenario modeling with conservative, base, and optimistic cases, and set explicit kill or scale thresholds based on cost per outcome metrics for better decision-making.
Measure benefits in terms of tangible units like cost per document or cycle time reduction, and avoid overestimating intangible benefits by presenting them as ranges supported by conservative proxies.
Conduct phased pilots lasting four to twelve weeks with explicit evaluation points, ensuring cost and value are recognized progressively rather than upfront, and require documented assumptions to defend ROI claims.
Table of Contents
The stepwise AI ROI calculation framework
Calculating AI ROI properly is less about the maths and more about sequencing. Get the order wrong and you end up with a number that looks precise but collapses under a CFO’s first question. Financial leaders who’ve reviewed dozens of AI business cases will ask about your denominator before they even glance at your projected benefit.
Here’s the sequence that holds up:
Define the objective and its KPIs. Pick one primary outcome (revenue, cost, or throughput) and name the exact metric that proves it moved.
Establish a baseline. Measure current performance for at least four to six weeks before touching the AI system, so you have a clean “before” figure.
Estimate tangible benefits. Quantify revenue lift, cost reduction, or productivity gain using the baseline as your comparison point.
Build total cost of ownership. Include model or API fees, compute, integration, and the people running it, not just the software licence.
Set your timeframe. Decide whether you’re measuring a 90-day pilot, a 12-month rollout, or a 3-year horizon, and be explicit about which.
Model three scenarios. Run conservative, base, and optimistic cases so the number survives scrutiny rather than collapsing under a single assumption.
For board approval, predefine two or three KPIs that map directly to money: a cost-per-transaction figure, a revenue-per-customer metric, or a cycle-time reduction you can convert to labour cost. Vague KPIs like “improved efficiency” get rejected on sight.
A one-page value hypothesis works better than a slide deck. State the problem, the proposed AI intervention, the expected benefit range, the estimated cost, and the kill/scale decision point. Sentient Concepts’ AI strategy and roadmap work often starts exactly here, because a badly framed hypothesis at week one produces a badly framed ROI figure at month six.
Core formulas and worked examples for AI ROI
The canonical ROI formula is straightforward: ROI = (Total benefits − Total costs) / Total costs × 100. The complication with AI isn’t the formula, it’s that generic financial models don’t adjust for AI’s specific cost structure, particularly inference costs that scale with usage rather than staying fixed like a software licence.
Cost per Outcome is the more useful working metric because it survives scaling. The AWS Cloud Financial Management framework treats it as the building block for defensible ROI: attribute every cost to the specific outcome it produces, then divide.
Worked example: document processing.
Monthly AI cost (API, compute, oversight): $8,000
Documents processed: 4,000
Cost per Outcome: $2 per document
Previous manual cost per document: $6
Monthly benefit: $16,000 saved
ROI: (16,000 − 8,000) / 8,000 × 100 = 100%
Worked example: 3-year NPV.
Year 1 net cash flow: −$40,000 (build and ramp costs exceed benefit)
Year 2 net cash flow: +$60,000
Year 3 net cash flow: +$90,000
Discounted at 8%, the project turns cash-positive inside Year 2 and shows a positive NPV by Year 3.
What moves this number most isn’t the discount rate. It’s the ramp assumption in Year 1, because organisations often take around 14 months to realise full value from certain AI workloads. Model that ramp honestly or your Year 1 number will embarrass you at the first review.
How do you establish credible baselines and attribute value?
Instrumentation is the unglamorous part of measuring AI ROI, and it’s also the part that determines whether anyone believes your final number. Without per-initiative cost allocation, any ROI claim lacks defensibility the moment someone in finance asks how you isolated the AI system’s contribution from everything else happening in the business that quarter.
Start simple:
Tag every AI-related project cost at the request or ticket level, not at the departmental level.
Use holdout groups or A/B tests where feasible, running for at least four to six weeks to smooth out weekly variance.
Document your conversion assumptions in writing, particularly how you translate hours saved into pounds saved.
Pro Tip: Keep a single shared spreadsheet tab labelled “Assumptions” that lists every conversion factor and its justification. When an auditor or CFO challenges a number eighteen months later, that tab is what saves the meeting.
What should count in AI total cost of ownership?
Most AI business cases undercount costs by 30 to 40% because they only capture the obvious licence fee. A defensible TCO figure needs both the direct spend and the costs that show up quietly six months into production.
Direct costs: model and API fees, cloud compute, software licences.
People costs: the project team during build, plus ongoing operations staff once live.
Hidden recurring costs: data engineering, governance and compliance review, change management, and a contingency buffer of roughly 10 to 15%.
One-off vs recurring treatment: capitalise build costs across your modelling timeframe rather than expensing them entirely in Year 1, which flatters early ROI and distorts the comparison.
Get this wrong and your denominator understates reality, which makes an unremarkable initiative look like a triumph until someone recalculates it properly a year later.
How do you present intangible benefits without overstating them?
Leadership cares about a narrower set of intangibles than most business cases assume: customer satisfaction, risk reduction, and speed to decision. Everything else is noise that dilutes the argument.
Use conservative proxies, such as a satisfaction score movement or a reduction in complaint volume, and label them supplemental rather than core to the ROI figure.
Present intangibles as a range, not a single number, since a point estimate on something like “improved trust” invites immediate scepticism.
Keep the financial model clean and let intangibles support the narrative, not inflate the percentage.
A CFO will forgive a modest financial ROI if the intangible case is honest. They won’t forgive a financial ROI padded with invented intangible pounds.
What timeframe and decision rules should you use?
Realistic expectations matter more than optimistic ones here. Document automation and simple conversational agents tend to show measurable returns within one or two quarters. More complex agentic systems, especially those involving orchestration across multiple steps, often carry initial overhead of 10 to 20% before efficiency gains outweigh the setup cost.
Build three scenarios, varying adoption rate, error rate, and cost per unit between conservative, base, and optimistic cases.
Set a review cadence of every four to six weeks during pilot, then quarterly once in production.
Define kill/scale thresholds in advance, such as “scale if Cost per Outcome falls below $3 by week 12, kill if it exceeds $10.”
A three-scenario model with explicit kill/scale rules makes the business case resilient to scrutiny in a way a single confident number never does. Reviewers trust ranges with rules attached far more than they trust a solitary percentage.
Common pitfalls that undermine an AI ROI calculation
Three mistakes recur across nearly every flawed business case reviewed with prospective clients.
Counting raw hours saved as full financial benefit without applying a conversion factor, when productivity gains rarely convert 1:1 into pounds.
Pricing the pilot’s inference cost and assuming production scales linearly, when usage-based AI costs often rise faster than volume once concurrency and complexity increase.
Presenting ROI without a documented baseline, which means there’s nothing credible to measure the improvement against.
Build in a contingency line, write down every assumption, and never claim a percentage improvement over a baseline you never actually captured.
Which tools and templates make this calculation fast?
A useful AI ROI calculator needs exactly four inputs: baseline performance, projected benefit, total cost by category, and your chosen timeframe. Anything more elaborate slows you down without adding accuracy at this stage.
Run the numbers in this order: a quick unit-level test (Cost per Outcome for a single use case), then a scenario model across conservative, base, and optimistic cases, then a board-ready three-scenario deck with the kill/scale rules attached.
Instrumentation: request-level tagging or a simple logging layer.
Analytics: whatever dashboard tool your team already uses, no need to buy something new for this.
Spreadsheet model: three linked scenario tabs, one assumptions tab, one summary tab.
Marketing use cases often provide the cleanest early data because revenue attribution is already tracked; the Oxford Training Centre’s guide to AI in marketing is a useful reference for how personalisation and automation gains typically show up in revenue metrics.
How long should PoC, pilot, and production phases run?
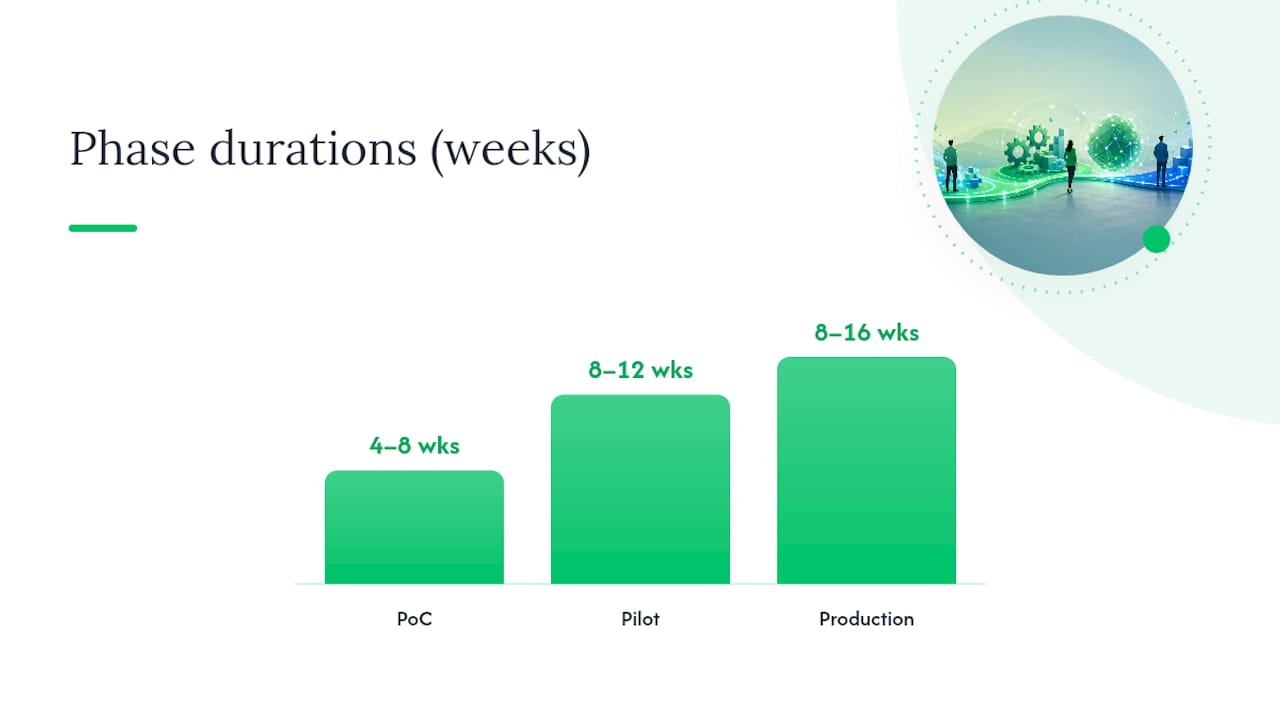
Phased funding lowers perceived risk because it ties spend to evidence rather than promises. A sensible cadence runs a proof of concept for 4 to 8 weeks, a pilot for 8 to 12 weeks, and production rollout for 8 to 16 weeks, each with an explicit go/no-go decision point before the next tranche of budget releases.
PoC: validate the technical approach and rough cost per outcome on a small dataset.
Pilot: run the holdout test, confirm the conversion factor, and check cost per outcome under real load.
Production: scale with the ongoing operations team in place and the review cadence running.
This structure aligns cost recognition with value maturity, so finance approves the next phase based on evidence rather than a forecast alone.
Pro Tip: Ask for readiness and data diligence work before the PoC even starts. A readiness assessment that surfaces data quality gaps early is far cheaper than discovering them mid-pilot.
Measurement is a leadership decision, not a finance exercise
Most AI business cases fail not because the technology underperforms, but because nobody insisted on unit economics before the money was spent. Leaders who demand a Cost per Outcome figure and explicit attribution assumptions before approving a pilot get better decisions six months later, whether the answer is “scale it” or “kill it.”
The discipline this guide describes, baseline first, attribution documented, kill/scale rules written down before launch, isn’t bureaucratic caution. It’s what separates a repeatable measurement practice from a collection of anecdotes dressed up as a percentage.
— Thomas Samuel
How Sentient Concepts helps you run this calculation properly
An alternative to piecing together strategy, build, and operations across separate vendors is to have one team stay accountable from the value hypothesis through to the production numbers, so nothing gets lost in a handoff between whoever scoped the pilot and whoever has to defend the ROI figure a year later.
That continuity matters most in the phases this guide covers. Sentient Concepts supports AI strategy and roadmap work to frame the value hypothesis, readiness and data diligence to make sure your baseline data is actually trustworthy, custom build work through the pilot, and managed AI operations once you’re in production and need the review cadence and cost-per-outcome tracking to keep running without drift.
If you’re preparing a business case this quarter and want a second opinion on your baseline, your cost categories, or your kill/scale thresholds, request a discovery conversation through managed AI operations and bring your draft numbers.
Sources
FAQ
What is the 30% rule in AI?
If you’ve encountered the term applied to a specific framework, treat it as that vendor’s own benchmark rather than an industry standard.
Is there any ROI on AI?
Yes, but it varies widely by use case and how well the initiative is instrumented. Well-run production initiatives with clear unit economics commonly clear 100 to 300% or more, while poorly measured pilots often show no defensible ROI at all because the baseline and attribution were never established.
What is the formula to calculate ROI?
ROI = (Total benefits − Total costs) / Total costs × 100. For AI specifically, pair this with Cost per Outcome so the figure holds up as usage scales.
What does a 20% ROI mean?
A 20% ROI means the benefit generated was 20% greater than the total cost invested, for the timeframe measured. On its own it’s not automatically “good” or “bad”: compare it against the next best use of that budget and against your payback horizon before judging it.
Recommended